 Adobe Illustrator
DataInk for Adobe Illustrator
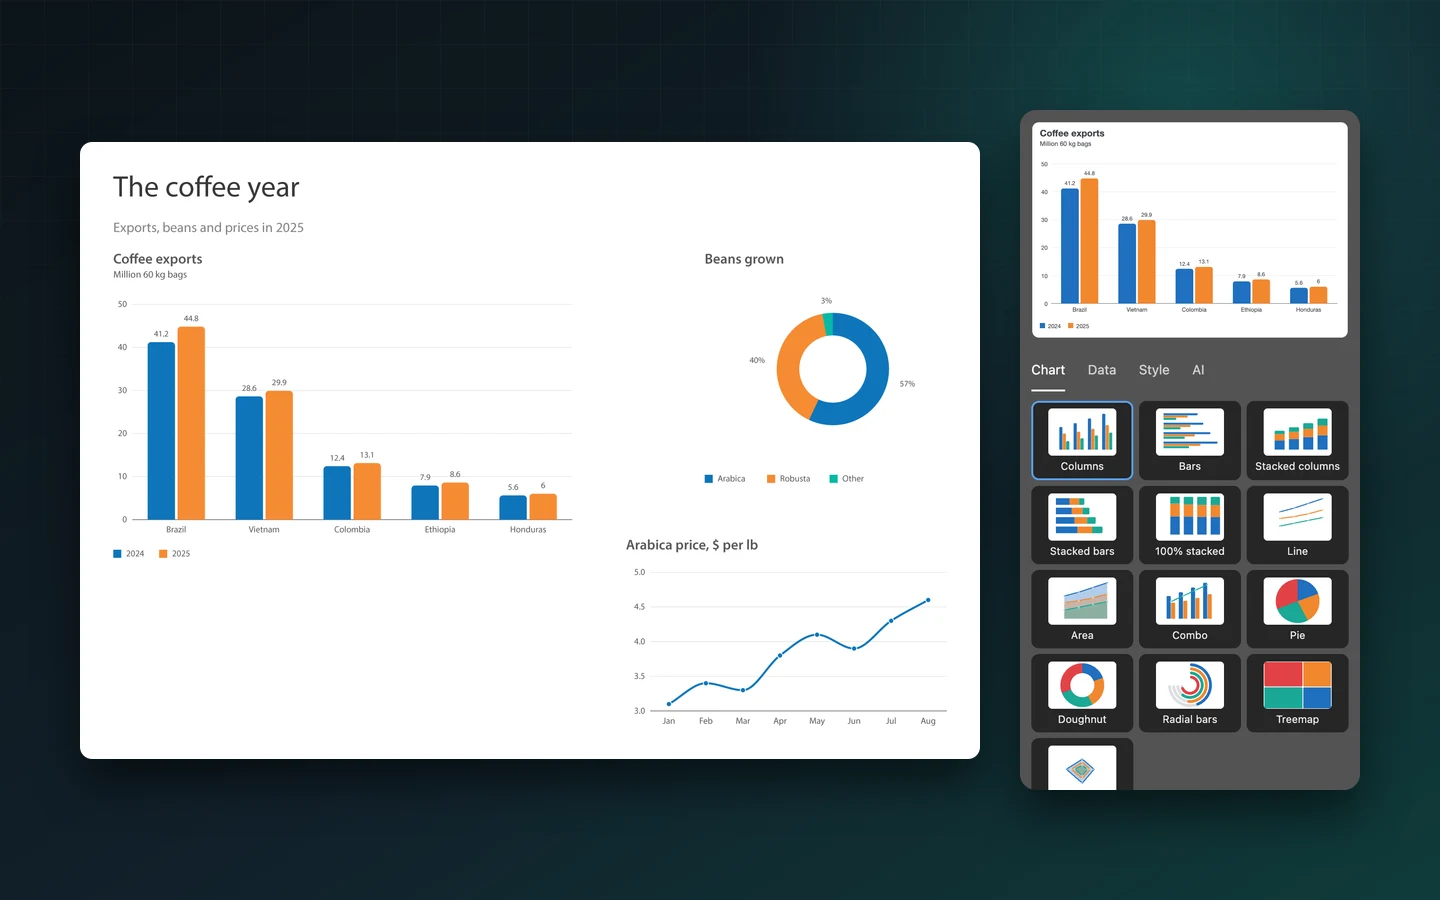
Draw bar, line, pie, doughnut, treemap and 8 more charts in Adobe Illustrator as real paths and text, coloured with your swatches and set in your character styles. Paste or import the numbers, add the chart, and update it whenever the data changes: your hand edits stay.
- 13 chart types, doughnut and treemap included
- Your swatches and character styles
- New numbers, your edits stay
- One-time $79, no subscription
- Works in
- Adobe Illustrator
- Adobe Illustrator 2022 (26.0) or later. Tested on Adobe Illustrator 2027 on macOS
- Price
- $79
- one-time purchase
- Support
- From the developers
- Updates included
The chart panel Adobe Illustrator's Graph tool never became
The Graph tool has nine chart types, no doughnut, no value labels, and it resets your styling when the data changes. DataInk does the chart part and leaves the design to you.
13 chart types
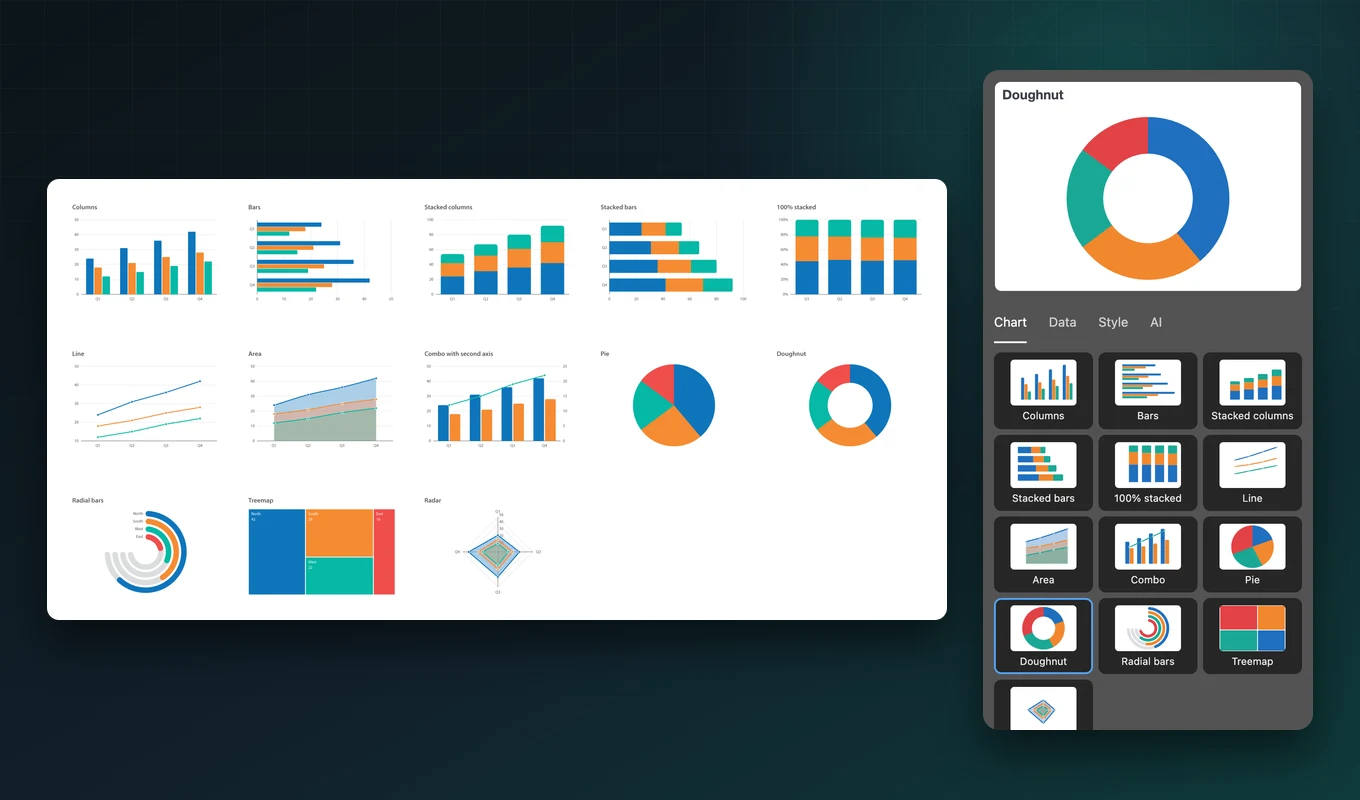
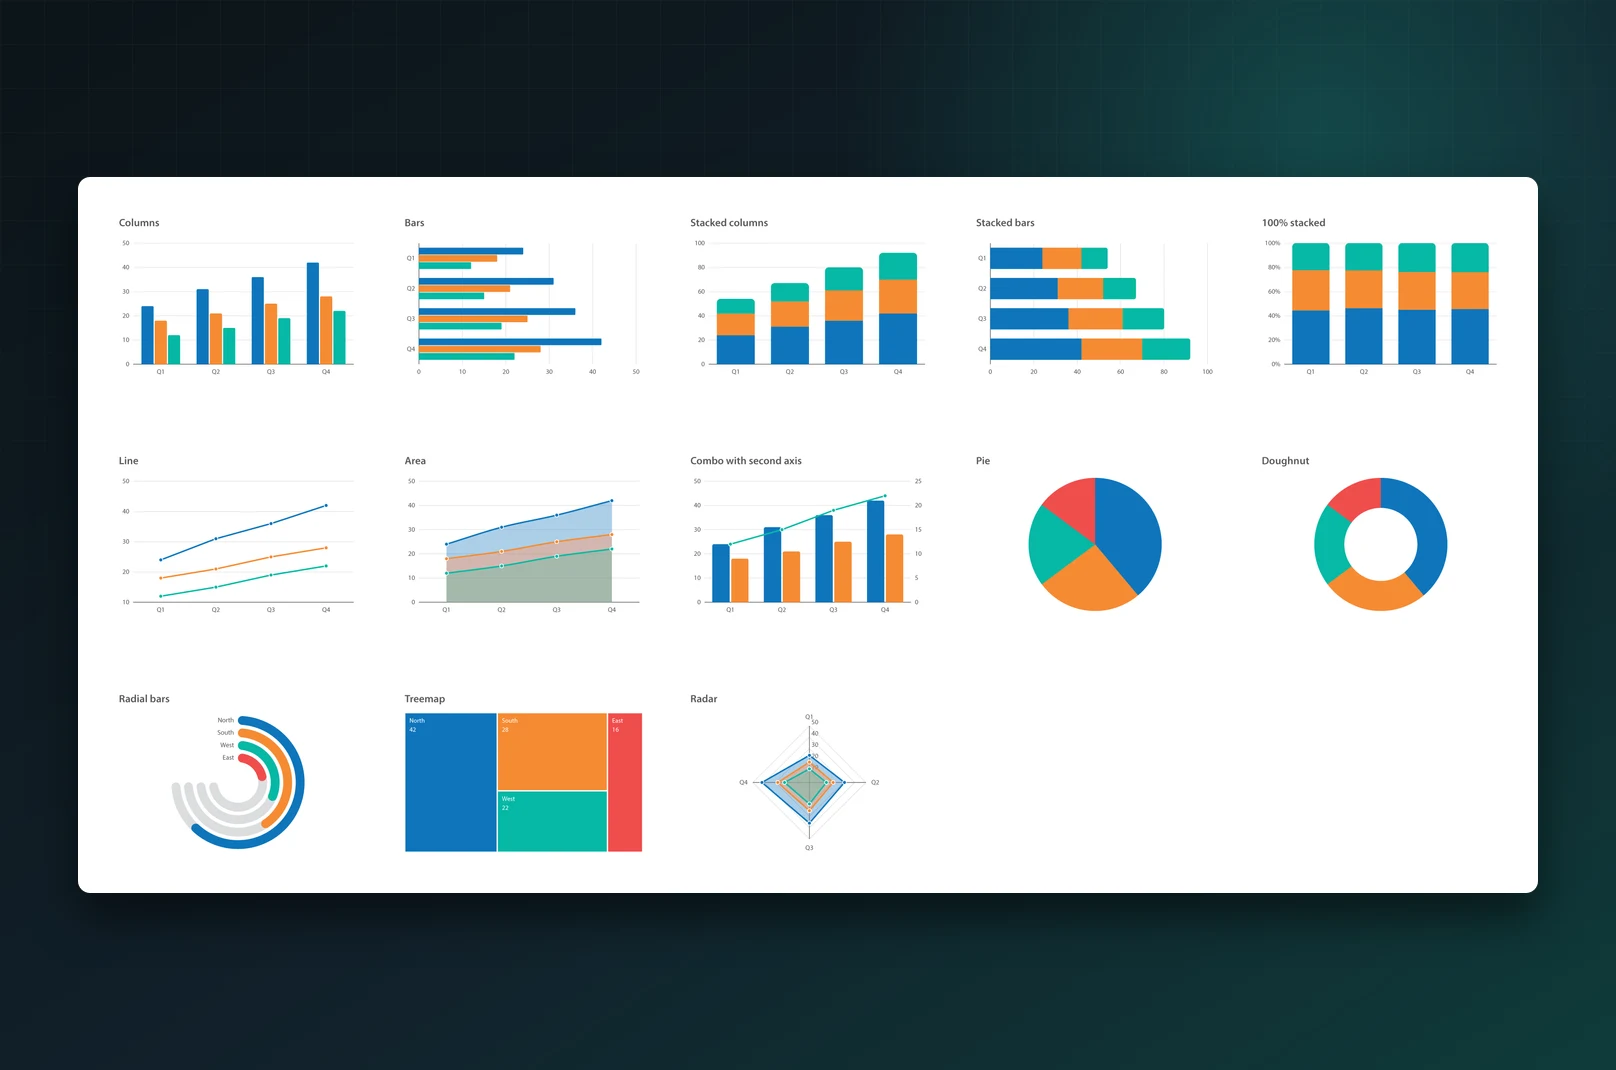
Columns, bars, stacked and 100% stacked, line, area, combo with a second axis, pie, doughnut (also as half circles), radial bars, treemap and radar.
Real Adobe Illustrator objects
Each chart is a group of paths and point text on the current layer, with every object named in the Layers panel. Your files open anywhere, with or without DataInk.
Your swatches
Colours are global swatches in a DataInk swatch group: edit one and every chart that uses it changes. Or pick one of your own swatch groups, or one colour in tints. CMYK documents get CMYK swatches.
Your character styles
Titles, axes, value labels and legends use character styles. Restyle one and every chart follows, or set each kind of text in a style you already have.
Update without losing edits
Select a chart and the panel loads its data. Change the numbers and click Update chart: fills, strokes, effects and text you changed by hand stay. Each update is one undo step.
Paste or import your data
Paste a table from Excel, Google Sheets or Numbers, or import a CSV or Excel file and pick the sheet. A large editor opens for long tables.
Details that matter in print
Round axis steps, gridlines, value labels inside or outside, number formats with prefix, suffix and short numbers, line weights in points, rounded bar ends and presets you can share.
Optional AI, with your own key
Read a table from a PDF, a screenshot or pasted text, or change a chart from a sentence. Works with OpenAI, Claude, Gemini or Ollama on your computer. DataInk works the same without it.
Feels like part of Adobe Illustrator
The panel follows all four interface brightness levels and speaks 12 languages. It works offline, with no account and no Lingway server.
From install to result in a few clicks
- 1
Paste your numbers
Paste a table from a spreadsheet into the Data tab, or import a CSV or Excel file.
- 2
Pick a chart and add it
Choose one of 13 chart types, set colours and text styles on the Style tab, and click Add chart.
- 3
Design it, then update it
Restyle the chart by hand like any artwork. When the numbers change, select it, edit the data and click Update chart.
See it inside the app
Charts for reports, brands and infographics
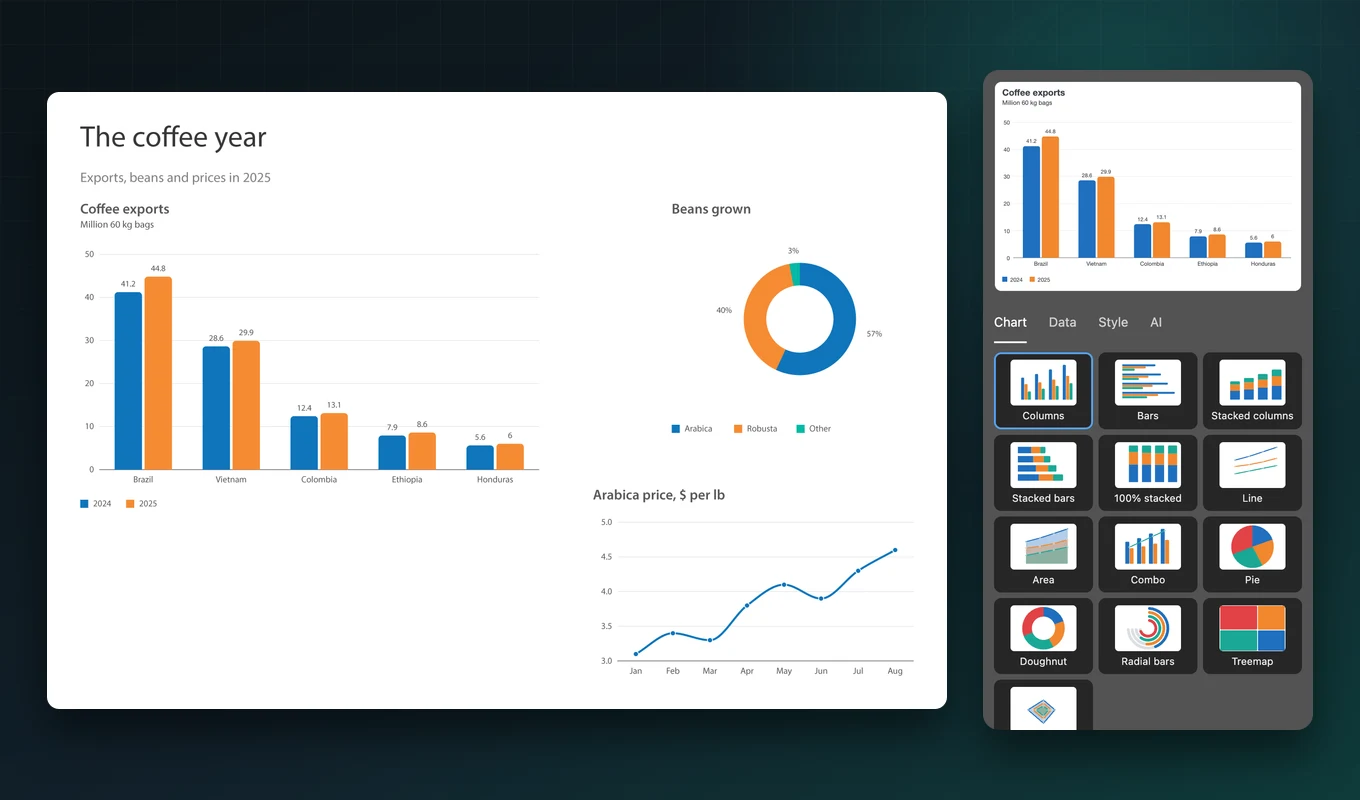
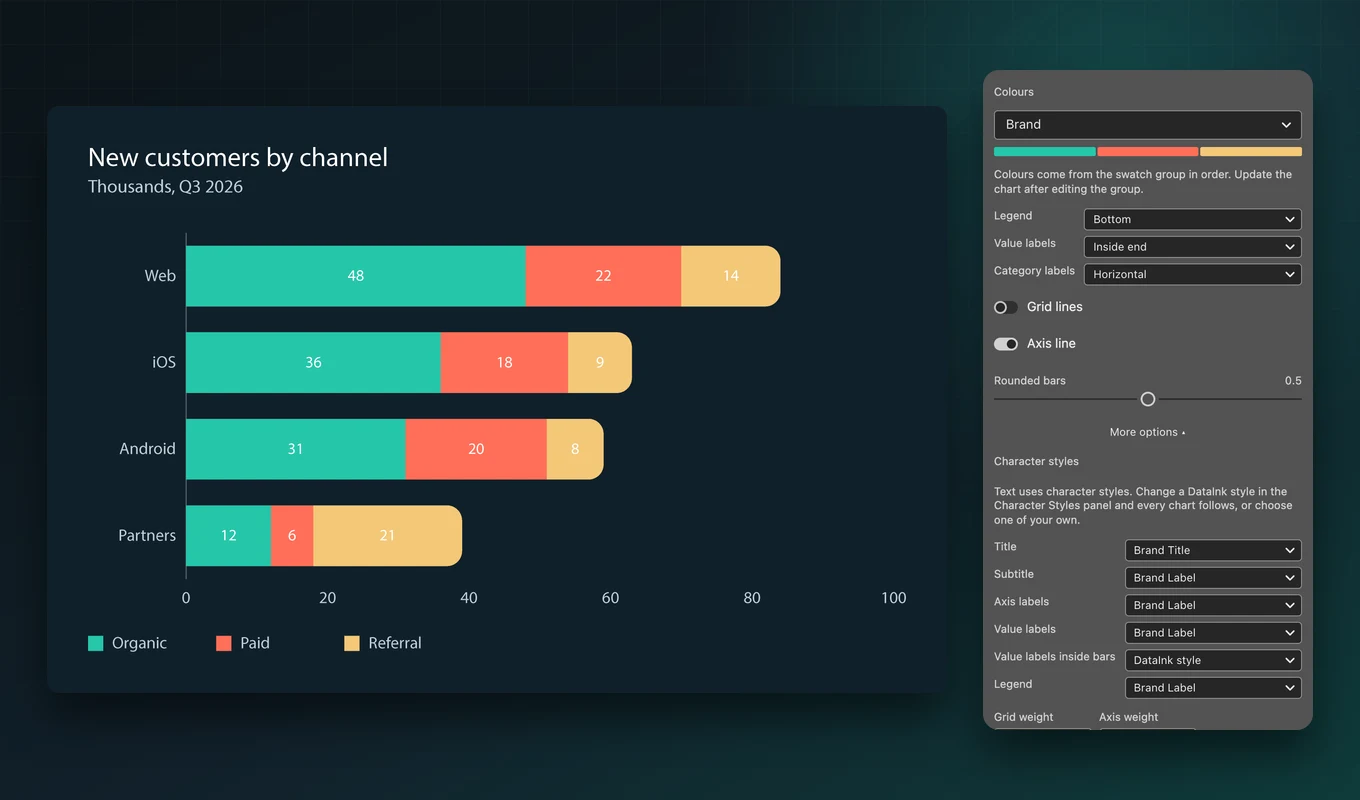
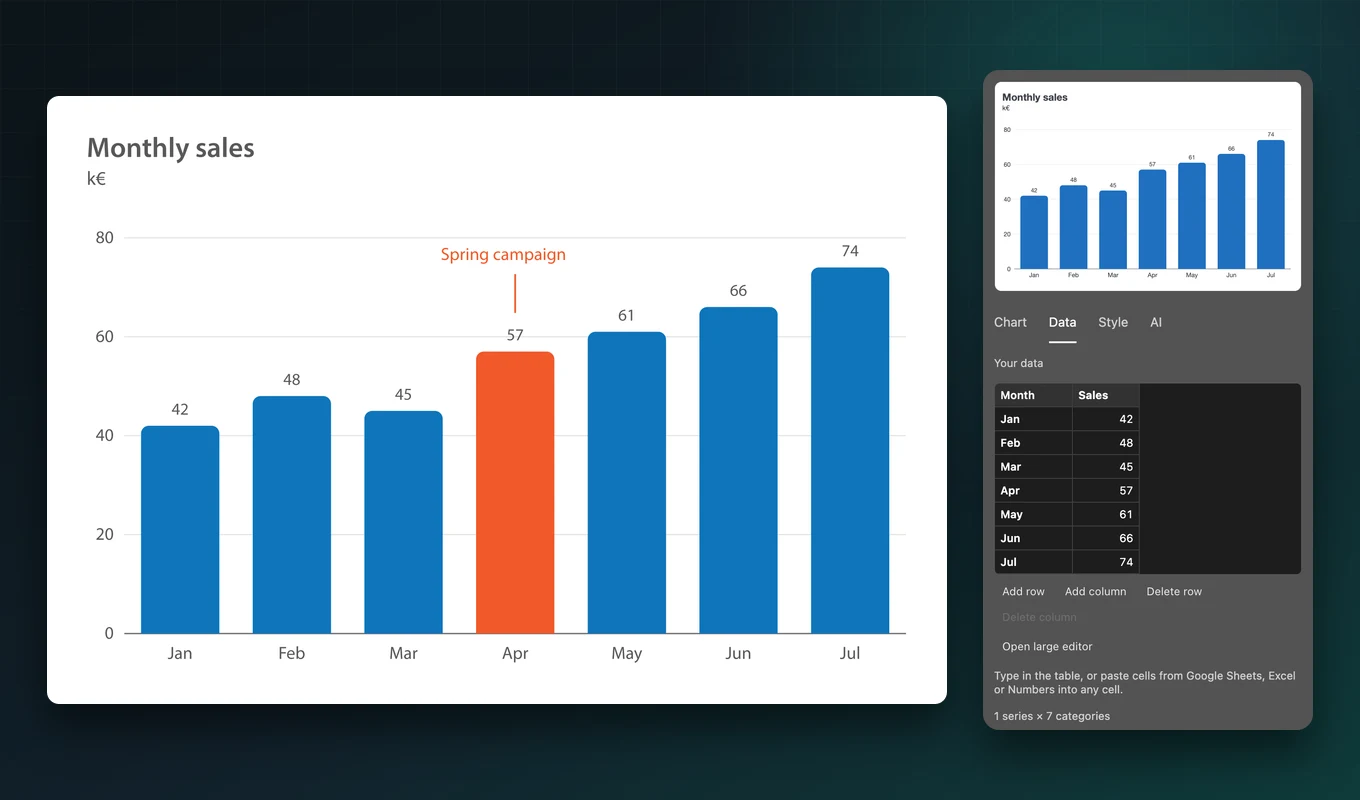
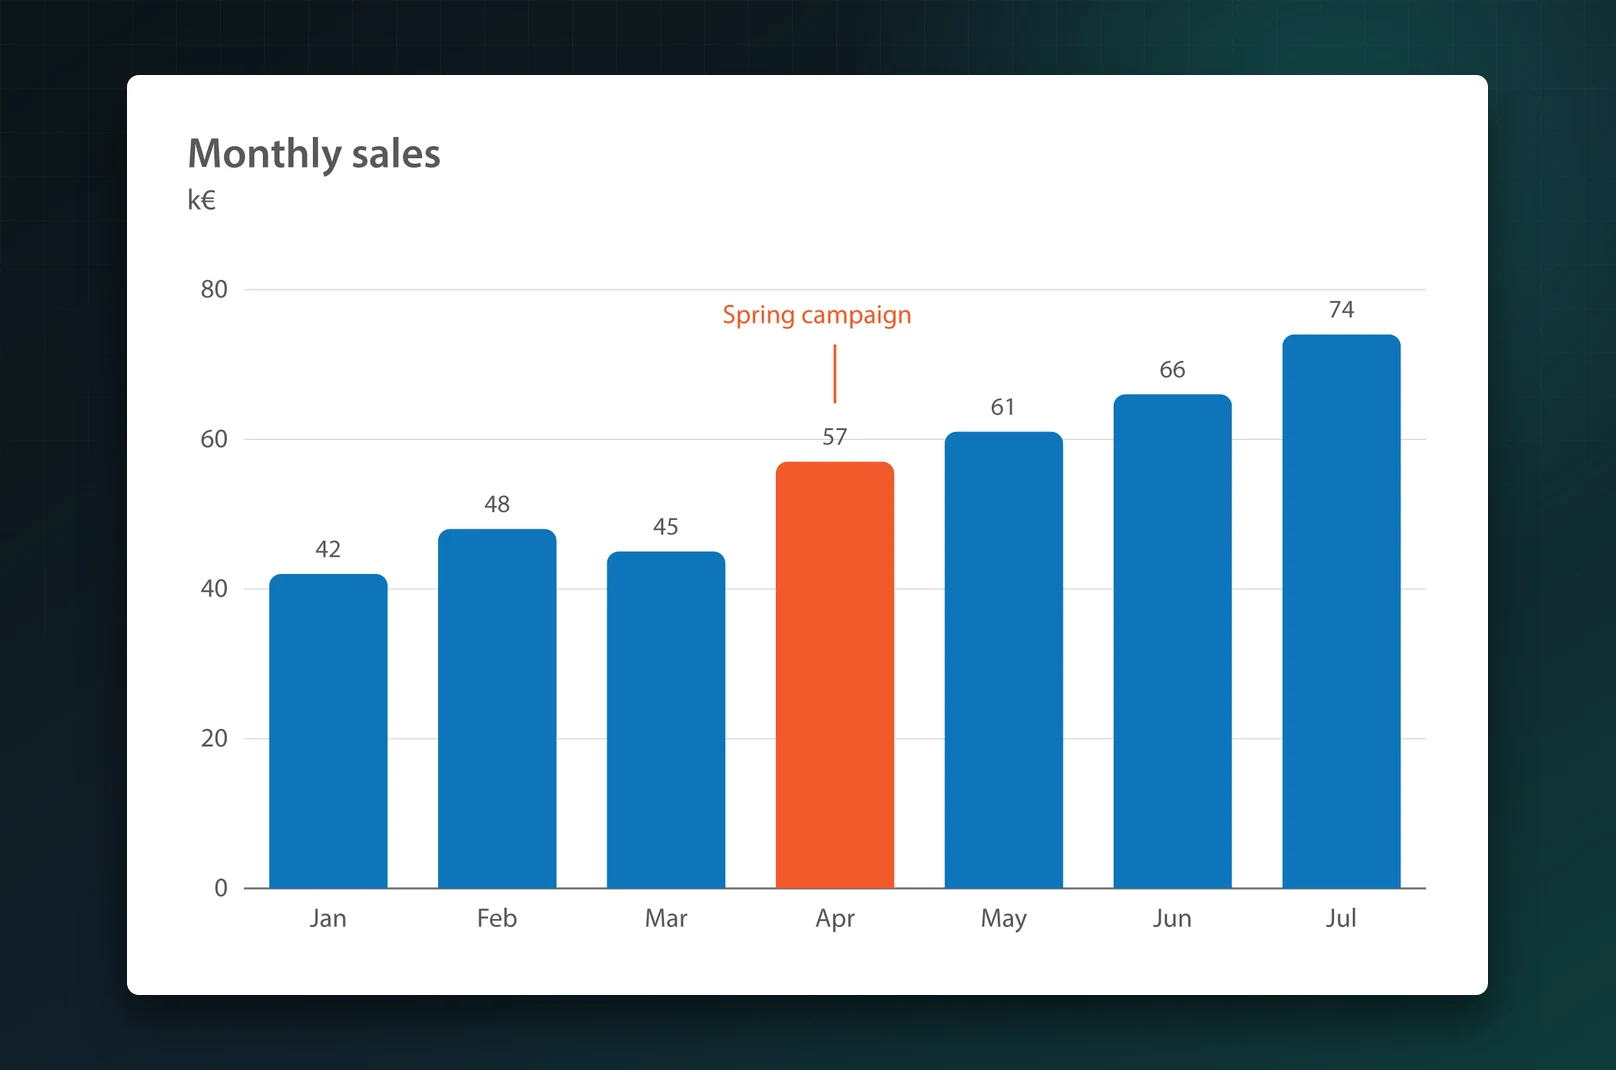
Every picture below is an Adobe Illustrator export of charts DataInk drew on a new document.
A report page in minutes
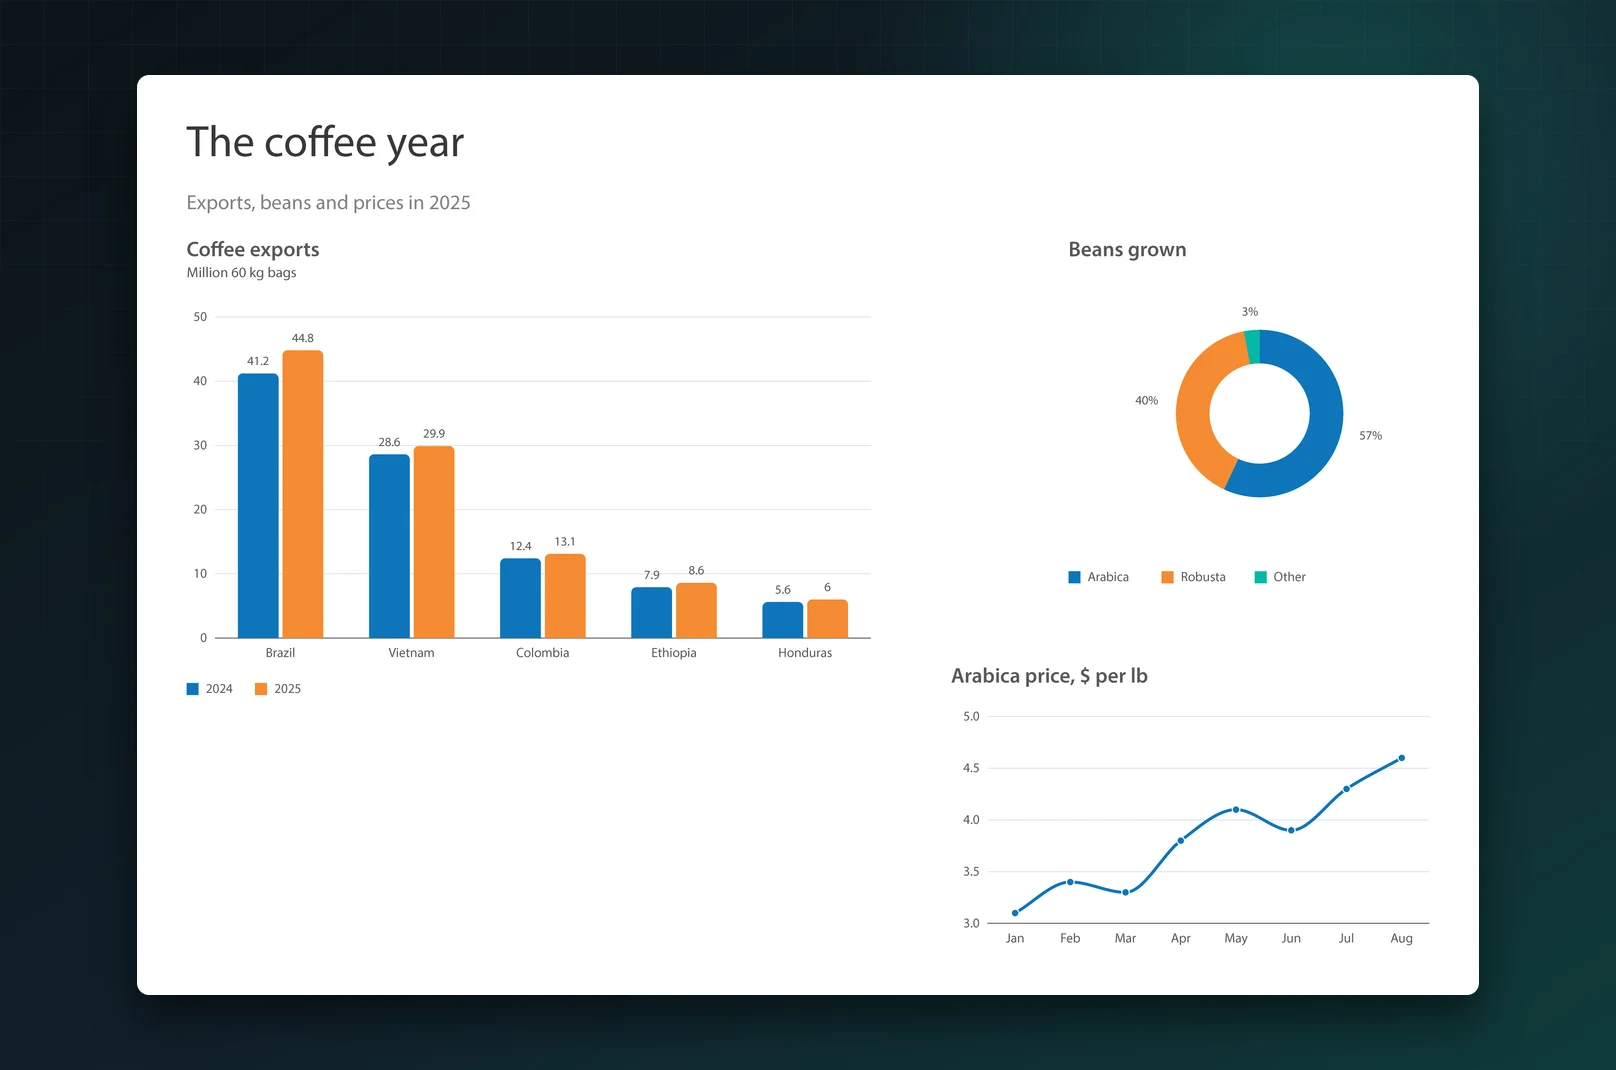
Paste the numbers, pick Columns, Doughnut or Line, and click Add chart. Each chart lands on the current layer as a named group, with round axis steps, gridlines, value labels and a legend.
Titles and subtitles are part of the chart, so a page of figures stays consistent from one chart to the next.
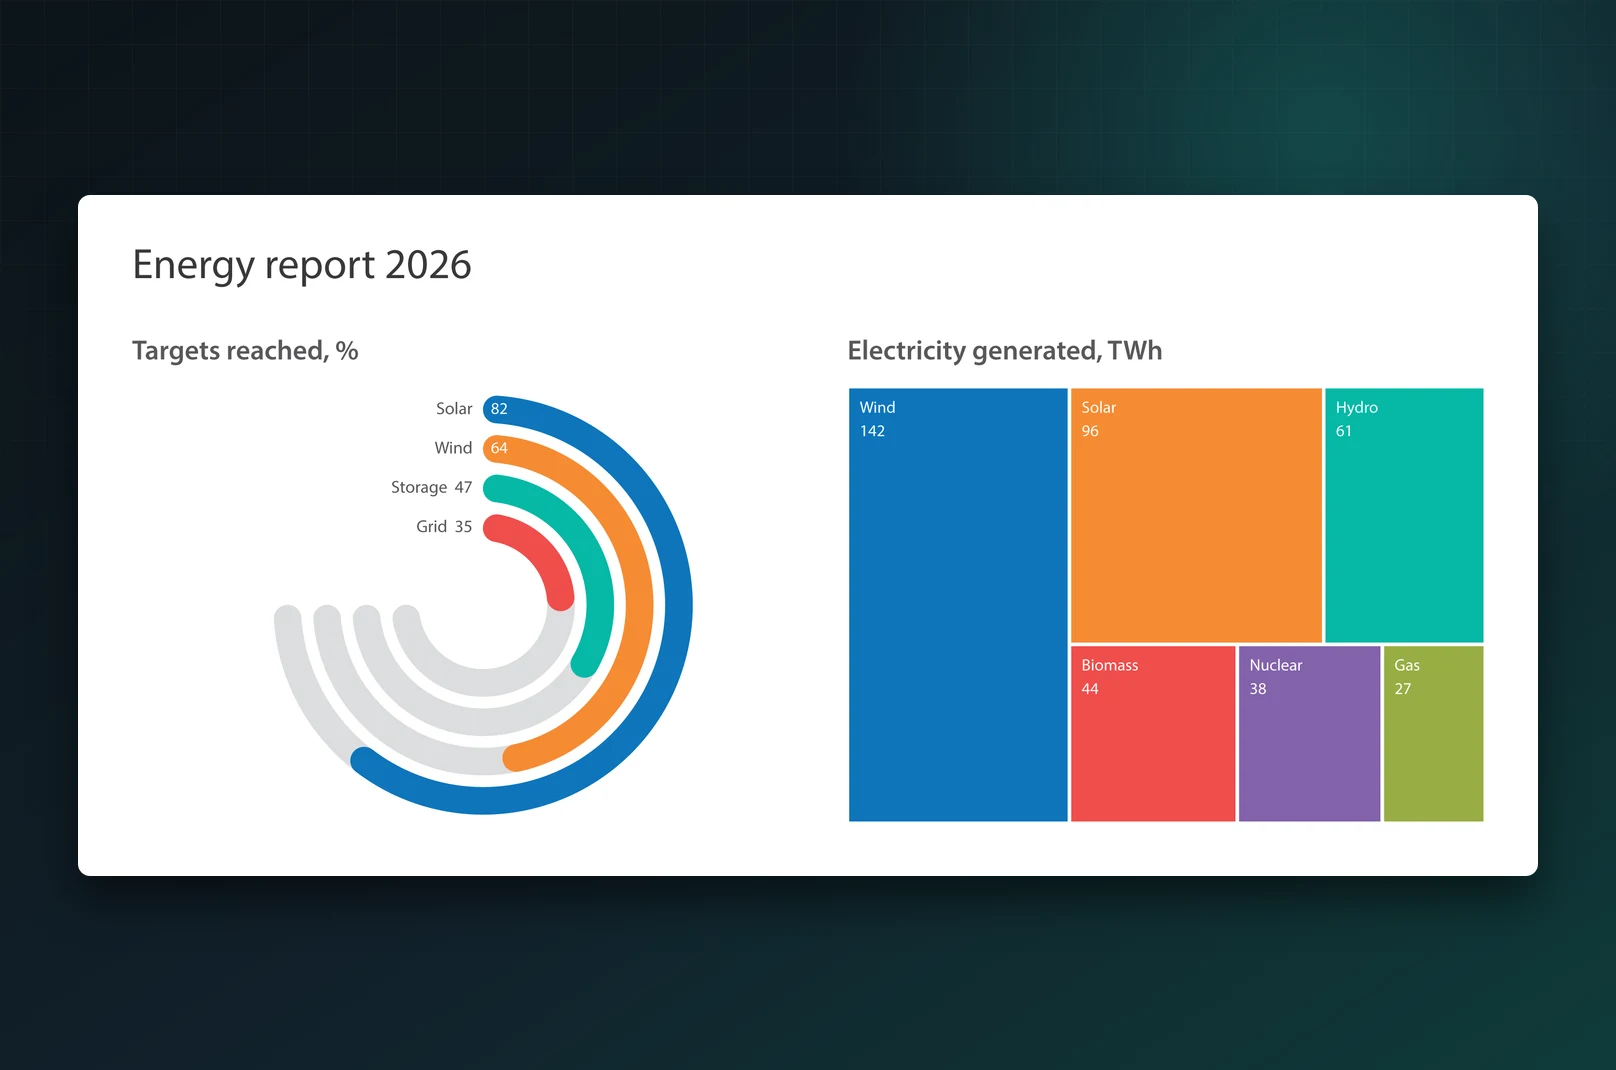
In your brand's colours and type
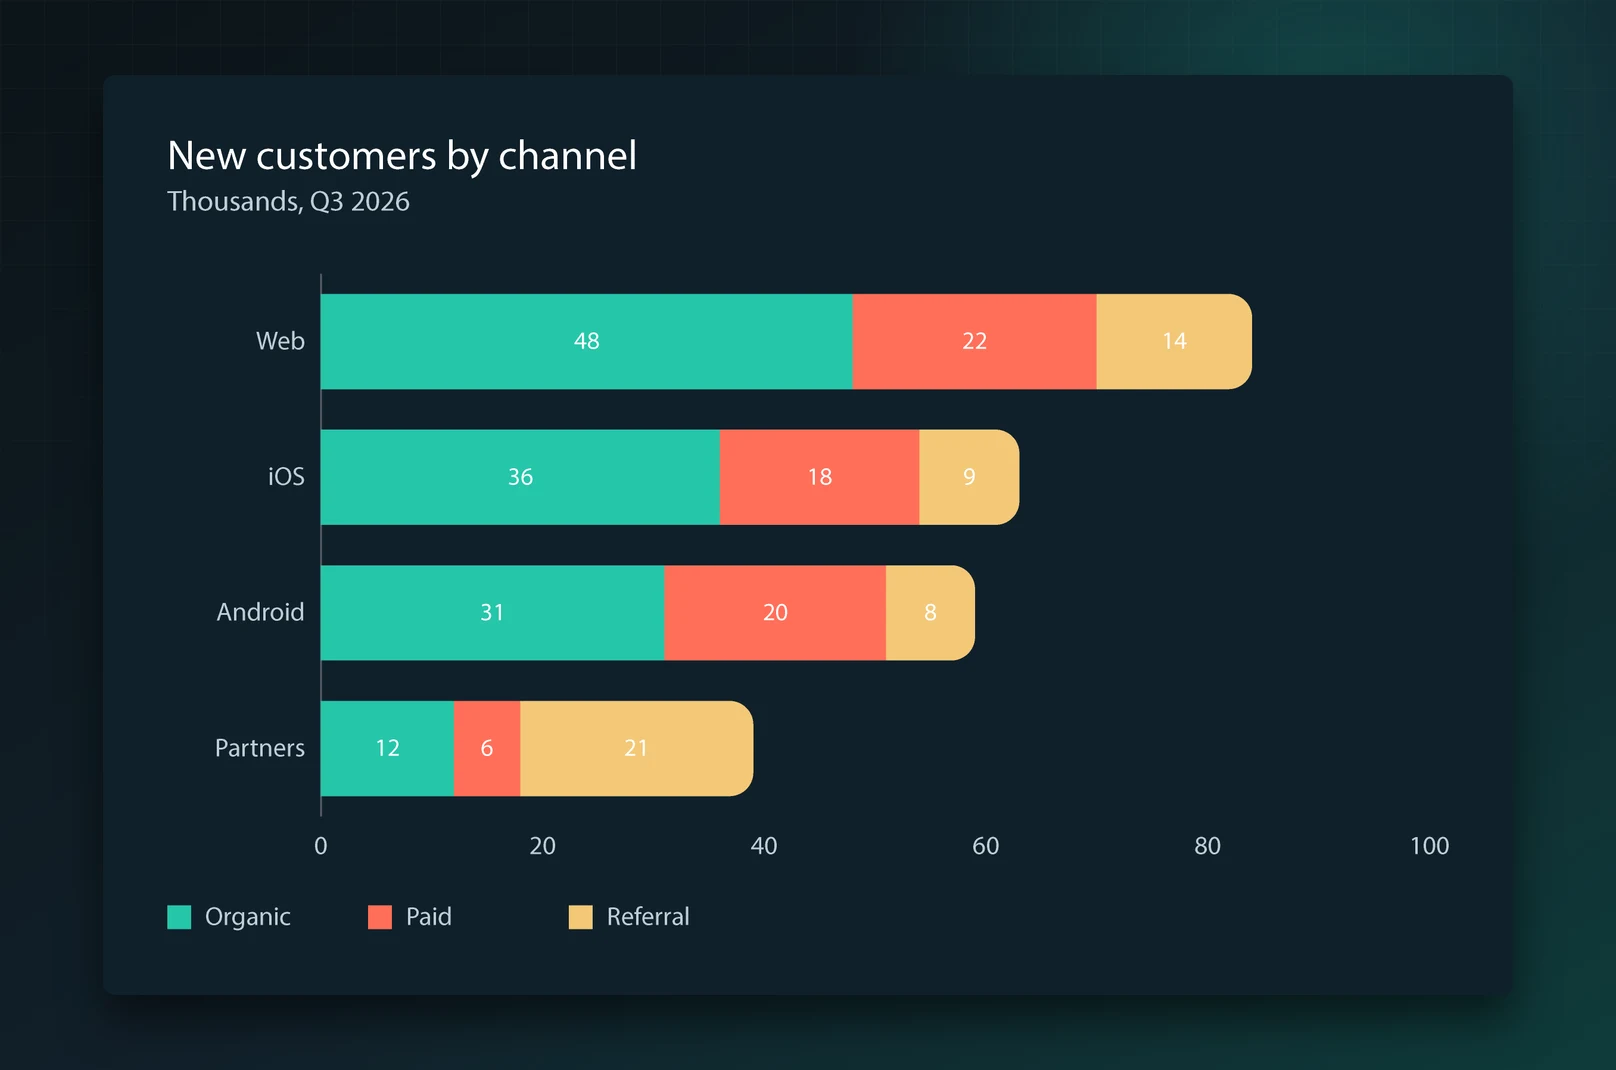
Choose one of your own swatch groups and the series take its colours in order. Set titles, axes, values and legend in your own character styles.
Because the colours are global swatches and the text uses styles, changing the brand later means editing one swatch or one style, not every chart.
New numbers, your edits stay
Highlight a bar in another colour, add a note, move a label. When the data changes, select the chart, edit the table and click Update chart: the chart is redrawn in place and your changes stay on the objects that still exist.
Scale the chart on the artboard and update it: it is laid out again at the new size and the text keeps its point size.
13 chart types
Columns, bars, stacked and 100% stacked, line, area and combo with a second axis; pie, doughnut and half doughnuts; radial bars, treemap and radar.
The panel shows a live preview and warns you when the data doesn't suit the chart, such as negative values in a pie.
Tables from PDFs and screenshots
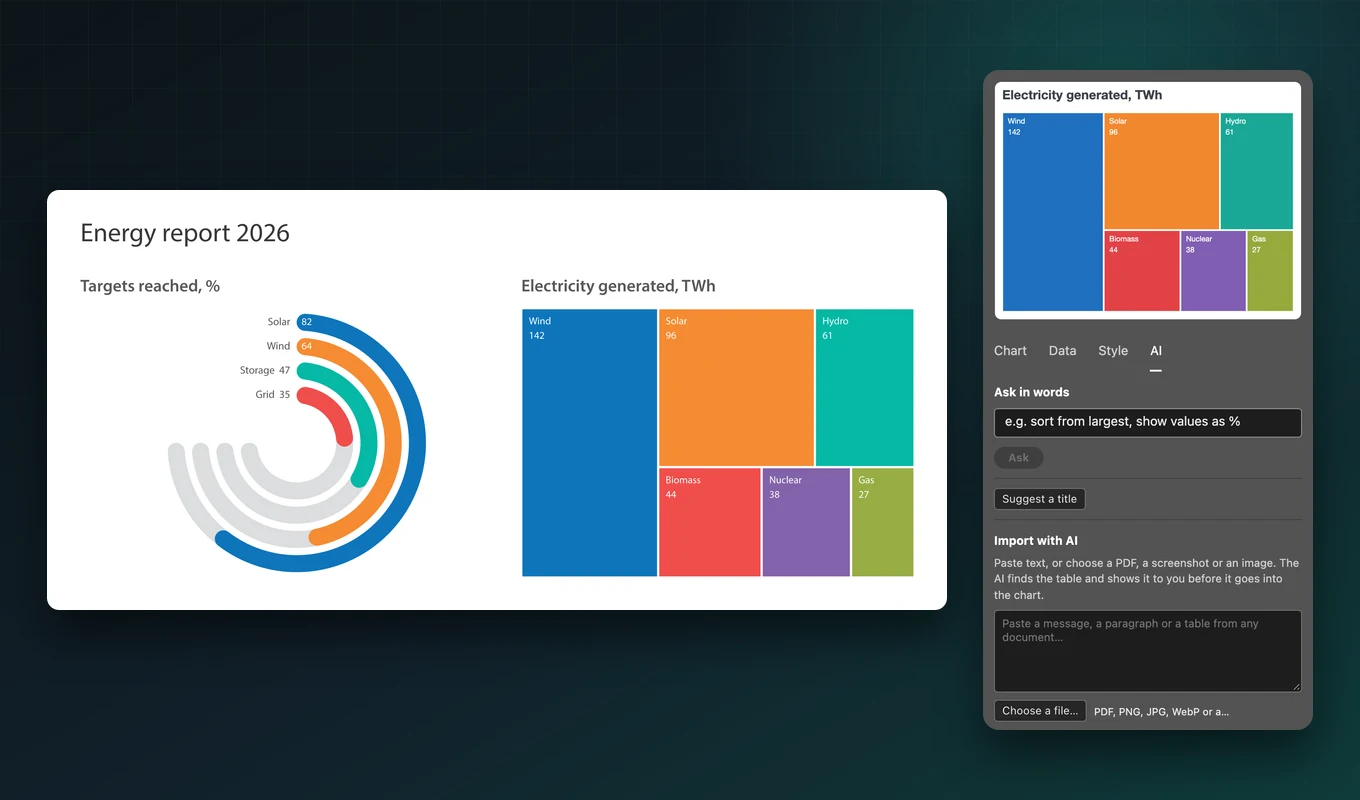
The optional AI tab reads a table from a PDF, an image or pasted text and fills the Data tab. You can also ask for changes in words, such as sort by 2025 and show values, or get title suggestions.
Use your own key for OpenAI, Claude or Gemini, or a model running on your computer with Ollama. The data goes straight from Adobe Illustrator to the provider you chose.
Built for production work
Annual and impact reports
Dozens of consistent charts in the report's colours and type, updated when the final figures arrive.
Brand and marketing designers
Charts for decks, social posts and one-pagers in the brand's swatches and character styles.
Infographic designers
Doughnuts, radial bars and treemaps as clean paths, ready to be styled and combined with illustration.
Editorial and news graphics
Accurate charts from a spreadsheet, quickly redrawn when the numbers are revised.
See DataInk in Adobe Illustrator
A report page built from pasted numbers, a chart restyled in a brand's swatches and character styles, and a chart updated with new data that keeps its hand-made highlight.
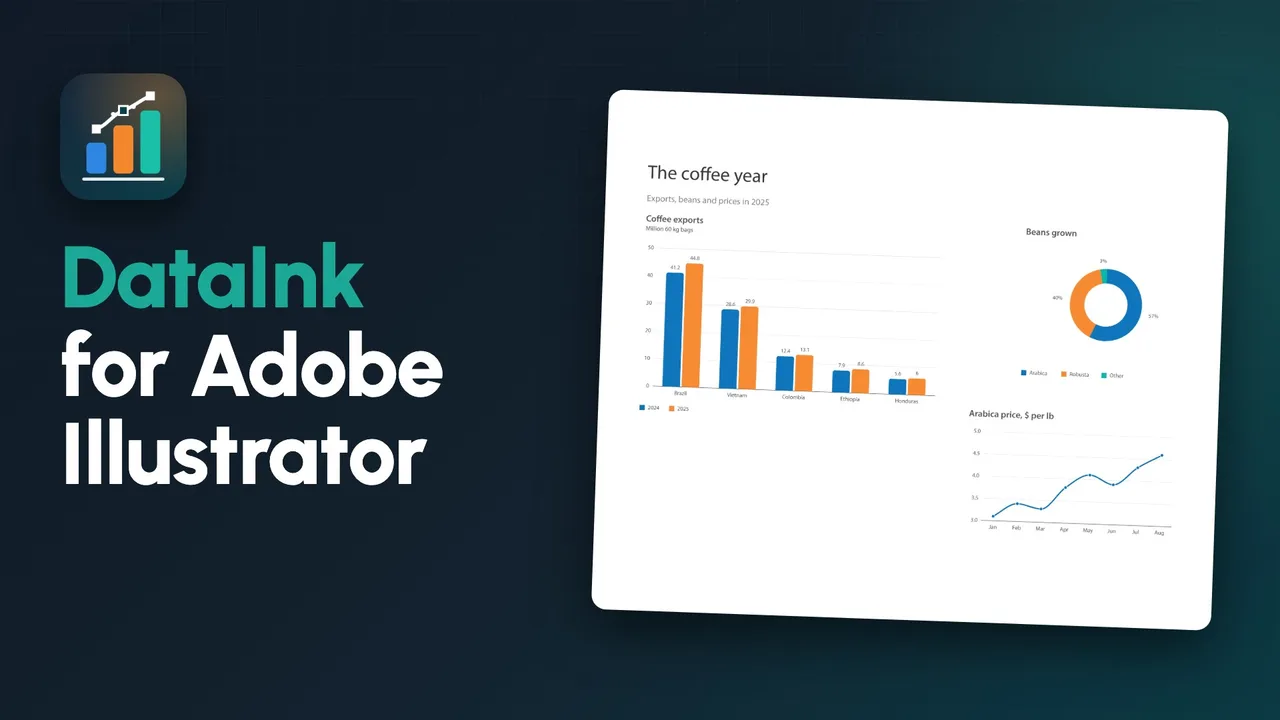 Plays from YouTube (privacy-enhanced mode)
Frequently asked questions
How is DataInk different from Adobe Illustrator's Graph tool?
The Graph tool has nine chart types, no doughnut, radial bars or treemap, no value labels, and it resets your styling when the data changes. DataInk has 13 chart types, value labels, your swatches and character styles, and keeps your hand edits when you update the numbers.
Is it a subscription?
No. You pay $79 once and get the 1.x updates. A 10-day trial lets you try every feature first.
Can I edit the chart by hand?
Yes. It's ordinary paths and text. Recolour a bar, add an effect or nudge a label; when you update the data later, those changes stay. Keep the chart grouped to keep the link to its data: once ungrouped it is plain artwork.
Can I convert charts made with the Graph tool?
Not directly: Adobe Illustrator doesn't give plugins access to a graph's data. Copy the numbers from the graph data window and paste them into DataInk.
Does it work in CMYK documents?
Yes. Swatches are created in the document's colour mode, so CMYK documents get CMYK swatches and RGB documents get RGB ones.
Do my files open without the plugin?
Yes. Charts are normal artwork, so anyone can open, print and edit the file. You only need DataInk to update a chart from new data.
Do I need an account or an internet connection?
No. DataInk runs inside Adobe Illustrator and sends nothing anywhere. Only the optional AI features go online, to the provider you choose, with your own key.
Which versions of Adobe Illustrator does it support?
Adobe Illustrator 2022 (26.0) and later, on macOS and Windows. We tested it on Adobe Illustrator 2027 on macOS.
I also use Adobe InDesign. Is there a version for it?
Yes: DataInk for Adobe InDesign draws the same chart types as native InDesign objects. It's a separate product.
More from Lingway

Bleedline for Adobe Photoshop
Bleed, crop marks, trim and bleed boxes and a PDF/X-4 setting for any Adobe Photoshop document, in one click.
View Product
Caliper for Adobe Illustrator
Sizes, gaps, specs and a legend for any Illustrator artwork, in one click and any unit.
View Product
Nano Banana Studio for Adobe Photoshop
Generate and edit images with Google Gemini inside Photoshop.
View Product